

LandSerf allows you to visualise and perform analysis on spatial data. It is primarily designed to be used with surface and elevation models, but will work with most types of 'GIS' data. It currently supports raster DEM and vector TIN, contour and metric surface network models of elevation. What makes the software unique, is the ability to perform surface analysis over a range of scales, and characterise any scale dependent behaviour.
Depending on how you installed the software, LandSerf can either be started from the Start Menu (Windows), a desktop icon (Windows, MacOS, Unix), or the command line (Windows, MacOS, Unix). By starting from the command line, various command line parameters can also be provided that will start LandSerf with rasters and/or vector files preloaded. The options are given below.
| Command line parameter | Explanation |
surface|primary <raster_file> | Starts with the given file loaded as the primary raster |
drape|secondary <raster_file> | Starts with the given file loaded as the secondary raster |
raster <raster_file> | Starts with the given file loaded as an unselected raster |
vector <vector_file> | Starts with the given vector file loaded |
display <raster|relief|clear|vector> | Starts with the given display type |
| Examples: | |
LandSerf primary c:\data\mountains.srf secondary "c:\My Images\photo.jpg" display relief | |
Start LandSerf (in Windows) with the file mountains.srf displayed as a shaded relief map with the image photo.jpg draped over it. | |
landserf vector ~/data/coast.vec vector ~data/landuse.shp display vector | |
Start LandSerf (in Unix) with the files coast.vec and landuse.shp pre-loaded, with the second of these displayed. | |
The software is largely controlled via a series of menus or buttons that either perform actions or open further dialogue boxes. Graphics appear in the main area of the window, while 'thumbnail' images of all loaded data appear in the left-hand area. The status of the system is reported at the bottom of the window.
For processing that is likely to take some time, a 'percentage complete' bar is displayed in the bottom
right-hand corner. The entire window can be resized at any stage with all graphics being rescaled
accordingly.
 LandSerf's initial screen.
LandSerf can store any number of raster or vector objects, limited only be the memory of the local system. Much of the raster analysis and display is applied to the current primary raster and possibly a secondary raster. To select a primary raster, click on the relevant thumbnail with the left mouse button. A primary raster will then be indicated by the black border around the thumbnail image. Secondary raster selection can be made by clicking on a thumbnail with the right menu button or with the left button while holding down the shift key. Note that the order of thumbnails does not determine their primary/secondary status. To select a vector map for processing, click on the relevant vector map thumbnail with the left mouse button.
The range of visualisation and analysis options available will depend on the number and type of spatial
objects that have been been selected.
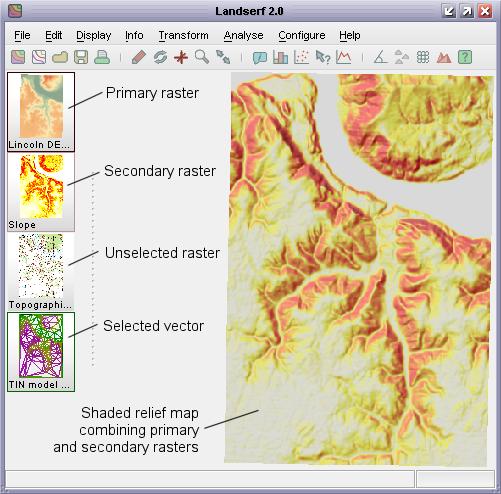 Spatial object selection.
LandSerf keeps a record of all options chosen by the user as well as any messages displayed in the
status bar at the bottom of the screen. This can be useful if you wish to recall a sequence of
operations previously undertaken. The record is stored in a file called landserfLog.txt in
the main LandSerf directory. This file is reset every time a new session is started. Additionally, the
logging output is echoed to the LandSerf console (see figure below), which can be viewed at any
time by selecting the Help->Show console menu option.
 LandSerf console output.
Any errors that stop LandSerf from working correctly are also reported to the console/log file. If these
errors appear to be a bug with the program, please report them to jwo@landserf.org attaching
the landserfLog.txt file that reports the error.
The following features are currently available in LandSerf 2. Items in italics are new to version 2.0.