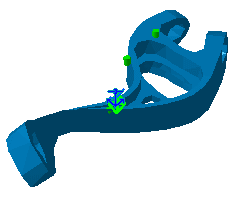
Viewing Frequency Results
| This task will show you how to
visualize Vibration Modes after computing the Frequency Analysis Case and how to generate a Report.
|
|||||||
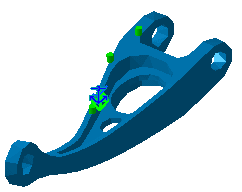
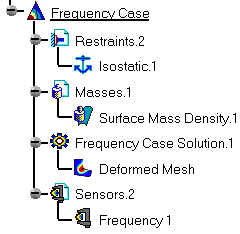
| 1. Click the Deformation icon An image of the deformation corresponding to the first vibration mode is displayed, and the Deformed Mesh image object appears in the specification tree under the Frequency Case Solution.1 objects set.
|
|||||||
| 2. Double-click the Deformed
Mesh object in the specification tree to edit
the image.
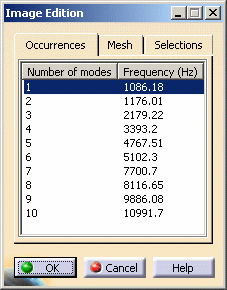
The Image Fem Editor dialog box, containing the list of vibration modes with the corresponding frequency occurrences is displayed. You can visualize any mode by clicking it in this multi-occurrence list.
|
|||||||
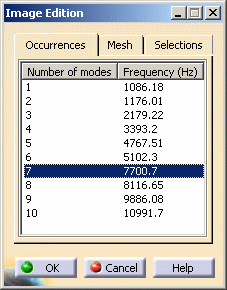
| 3. Click the seventh mode in the multi-occurrence
list, for example.
The selected mode is displayed.
4. Once you have finished editing images, click OK in the dialog box.
|
|||||||
|
|||||||
|
|
|||||||
