|
|||||||
|
||||||||
To display raster surface models, select either Raster or
Relief from the Display menu. The former will
display either the surface or drape model depending on which has
been selected. The raster is coloured according to the colour rules
associated with it (see Editing Colours below). Raster values that fall
between those with defined colours are given a linearly interpolated colour
value. This gives a continuous range of colours for most DEMs.
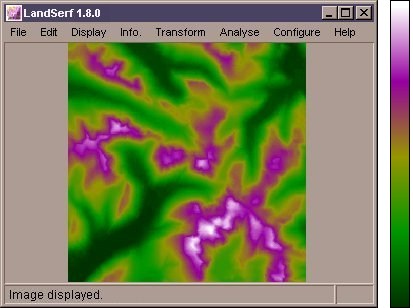 Interpolated 'k-colour' surface.
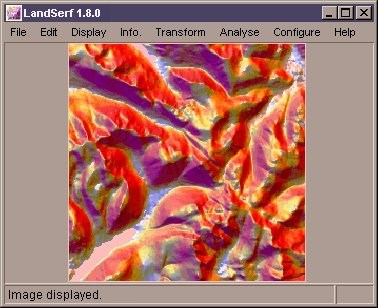
By selecting Relief the coloured raster may be enhanced by
blending it with shaded relief values.
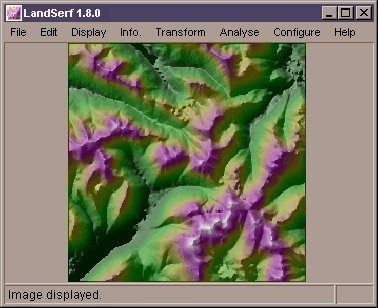 Shaded relief blended with coloured surface.
The relative balance of the two elements along with other shaded relief parameters may be controlled from
the Configure->Set shaded relief parameters menu option. The dialogue window allows the proportion of each
to be set ranging from 0% relief (identical to the coloured raster described above) to 100% relief (monochrome shadowed
surface). Typically, values between 30% and 70% tend to look most effective.
 Shaded parameters dialogue box.
The imaginary sun altitude and azimuth may also be set in the Shaded Relief Calculator
dialogue box. By default, the sun angle is a 45 degree elevation from
the north-west. Lower sun angles give more pronounced shadowing effects, while
azimuths from a southerly or easterly direction give the impression of inverted
topography. If a drape model exists, its colours may be combined with
the shaded relief calculated from the surface model.
To display the relief map with new parameters, reselect Relief from the Display menu.
The shine, specular and diffuse reflectance values only apply to the shaded relief calculations when chosen
from the Analyse->Calculate Surface Parameter... menu. Calculating relief this
way allows values to be calculated at arbitrary resolutions providing a both a smoother and more realistic
effect.
Vectors are displayed by selecting Vector from the
Display menu. This menu item is toggled on and off with further
selection. Colours are assigned to vector values using interpolation of colour
rules in an identical way to rasters.
 Vector contour lines.
Vector display may be combined with raster display by leaving the Vector
menu item checked before displaying a raster. It is usually advisable
to set the vector colours to simple contrasting colours so that they may be
seen against the raster background.
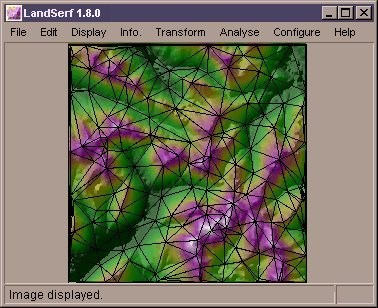 Vector TIN overlaid on shaded relief.
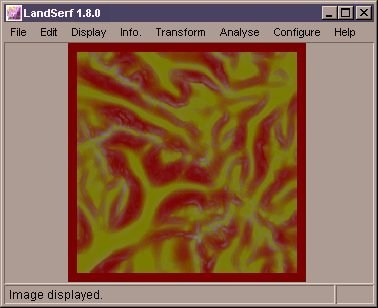
In order to visualise two surfaces simultaneously, it is possible to either
blend the Red, Green, Blue values together, or to blend the hues of one surface
with the saturation of the other. Both are selected from the Display
menu.
 RGB blend of slope and aspect.
When choosing the blend option, the percentage weighting given to
the currently selected surface is required. The closer to 100%, the closer the
blended image will resemble the colours of the currently selected surface.
Alternatively, the two surfaces can be mixed by combining the saturation (the 'greyness') of the currently selected surface and the hues of the other surface. Such combination can be particularly useful for representing uncertainty, with stronger saturation indicating greater certainty.
 Hue-saturation map of slope uncertainty.
The colour tables associated with either Vectors or Rasters may be edited by
selecting Edit Vector Colours or Edit Raster Colours
from the Edit menu. The colour table consists of a set of
colour rules that define the colours associated with pairs of values
in the elevation model. Values that fall between these two colours are
linearly interpolated. Colour rules are specified in one of the following
ways...
Where lval and uval the lower and upper values of the elevation model with which to associate colours; red, grn, blu are red, green and blue values ranging from 0-255; alpha is a transparency value ranging from 0 (transparent) to 255 (opaque).
 Editing a raster or vector colour table.
For example, the following
1 255 0 0 30 0 0 255
sets 1 to red, and 30 to blue with a continuous range of colours between them. For categorical data that should not have continuous colours, simply define lval and uval as the same value.
Once a colour rule has been entered, press the Apply rule button to
store the new rule. It will be placed in the list of rules shown in the dialogue
box, and the colour bar updated accordingly. To remove the entire set of colour
rules, press the New Colour Table button.
Alternatively, pressing the Default Colours button will create a
default continuous colour scale from the lowest to highest value in the raster
or vector being edited. This can save considerable time when colouring continuous
rasters, but should not be used for discrete data.
