Drawing Vector Maps

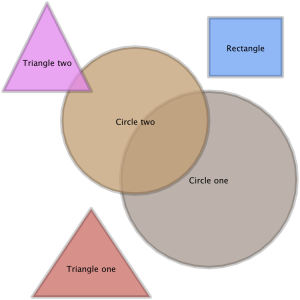
Creating an image from a vector map

By default, only point features can display labels. Therefore to show the labels associated with area or line objects, first find their centroids and store these new point values in a separate vector map. The draw() command can then draw both the original vector map (primary) and the labels vector map (secondary).

1
2
3
4
5
6
7
8
9
10
11
12
13
14
15
16
17
18
19
20
21
22
23
24
25
26
27
28
29
30
31
# Draws a vector map of area objects with labels.
version(1.0);

# Change the directory below to correspond to your file location.
baseDir = "c:/Program Files/LandSerf/data/landscriptExamples/";

# Open vector map containing area objects.
vectMap = open(baseDir&"shapes.vec");

# Create a new vector map containing shape centroids to use as labels
centroids = tocentroids(vectMap);

# Add a small border (1% of width) around vector map for display
border = (info(vectMap,"e")-info(vectMap,"w"))*0.01;
edit(vectMap,"s",info(vectMap,"s")-border);
edit(vectMap,"n",info(vectMap,"n")+border);
edit(vectMap,"w",info(vectMap,"w")-border);
edit(vectMap,"e",info(vectMap,"e")+border);

# Set drawing styles
vectorstyle("pointsize",0.1);
vectorstyle("showlabels","true");
vectorstyle("labelbackground","0 0 0 0");
vectorstyle("labelsize",28);
vectorstyle("labelposition","centre");
vectorstyle("linewidth",12);
vectorstyle("boundarycolour","0 0 0 50");
vectorstyle("polygonopacity",0.75);

# Draw the vector map with labels and save to file
draw(baseDir&"shapes.png","null","null",vectMap,centroids);
shapes.png:
shapes.png

Creating a high quality SVG image from a vector map

SVG (Scalable Vector Graphics) images preserve the high quality appearance of vector maps. Similar to the previous example, but this time, the centroid labels are combined with the original vector map so that a single map can be saved in SVG format.

1
2
3
4
5
6
7
8
9
10
11
12
13
14
15
16
17
18
19
20
21
22
23
24
25
26
27
28
29
30
31
32
33
34
# Saves a vector map of area objects with labels as an SVG file.
version(1.0);

# Change the directory below to correspond to your file location.
baseDir = "c:/Program Files/LandSerf/data/landscriptExamples/";

# Open vector map containing area objects.
vectMap = open(baseDir&"shapes.vec");

# Create a new vector map containing shape centroids to use as labels
centroids = tocentroids(vectMap);

# Combine the two vector maps
vectMap = combine(vectMap_,centroids_);

# Add a small border (1% of width) around vector map for display
border = (info(vectMap,"e")-info(vectMap,"w"))*0.01;
edit(vectMap,"s",info(vectMap,"s")-border);
edit(vectMap,"n",info(vectMap,"n")+border);
edit(vectMap,"w",info(vectMap,"w")-border);
edit(vectMap,"e",info(vectMap,"e")+border);

# Set drawing styles
vectorstyle("pointsize",0.1);
vectorstyle("showlabels","true");
vectorstyle("labelbackground","0 0 0 0");
vectorstyle("labelsize",14);
vectorstyle("labelposition","centre");
vectorstyle("linewidth",8);
vectorstyle("boundarycolour","255 255 255 50");
vectorstyle("polygonopacity",0.75);

# Save the combined map as an SVG file
save(vectMap,baseDir&"shapes.svg","svg");
shapes.svg: