Creating Ancillary Map Information

Creating a map legend

This example combines a simple raster and vector map to create a legend for a spatial object. The object is first loaded (line 15) and its colour table saved as a temporary file (line 22). A long thin raster, whose dimensions are determined in lines 8 and 9, is then created with continuous values that range from the object's minimum to maximum values (lines 25 and 30). By associating the spatial object's colour table with this new raster (line 67), the raster can be used to represent the colours as a colour bar.

A simple vector map is used to display the legend text. Each item of text is associated with a vector point (lines 35-40 and lines 55-60) with an attribute value containing the text to display (lines 41-45 and 61-65). Border spacing around the legend is created by adding some unlabeled points to the vector at the corner points (lines 35-36 and lines 55-56).

Finally, the labelling style is set (lines 75-78) and combined with the raster colour bar (line 81).

1
2
3
4
5
6
7
8
9
10
11
12
13
14
15
16
17
18
19
20
21
22
23
24
25
26
27
28
29
30
31
32
33
34
35
36
37
38
39
40
41
42
43
44
45
46
47
48
49
50
51
52
53
54
55
56
57
58
59
60
61
62
63
64
65
66
67
68
69
70
71
72
73
74
75
76
77
78
79
80
81
# Script to create a simple legend from a raster
version(1.0); 
 
# Change the directory below to correspond to your file location.
baseDir = "c:/Program Files/LandSerf/data/landscriptExamples/";

# Dimensions of colour bar in pixels.
longside  = 260;
shortside = 30;
fontSize  = 15;
border    = 20;
direction = "horizontal";

# Open the source object for which legend is to be produced.
map = open(baseDir&"dem.srf");

# Find attribute range and save colour table to a file.
minVal = info(map,"min");
maxVal = info(map,"max");
range = maxVal-minVal;
legendTitle = info(map,"title");
save(map,baseDir&"temp.ctb","colourtable");

# Create a thin rectangular raster to show colour table
colours = newraster(0,0,1,1,shortside,longside);

if (compare(direction,"vertical")==0);
{
    # This is the vertical colour bar.
    colours = newraster(0,0,1,1,longside,shortside);
    colours = maxVal - range*row/longside;
    vectorstyle("labelposition","east");

    # Create file representing vector map with legend annotation
    echo(-border&" "& -border&" 0\n"&
         longside+border &" "&longside+border&" 0\n"&
         shortside+fontSize*0.2 &" "&longside/2&" 1\n"&
         shortside+fontSize*0.2 &" "&fontSize*0.4&" 2\n"&
         shortside+fontSize*0.2 &" "&longside-fontSize*0.2&" 3\n",    
         baseDir&"temp.txt");
    echo("# ID Label\n"&
         "1 "&quote(legendTitle)&"\n"&
         "2 "&quote(round(minVal))&"\n"&
         "3 "&quote(round(maxVal)),
         baseDir&"temp.atr");
}

if (compare(direction,"vertical")!=0);
{
    # This is the horizontal colour bar.
    colours = minVal +range*col/longside;
    vectorstyle("labelposition","north");

    # Create file representing vector map with legend annotation
    echo(-border&" "& -border&" 0\n"&
         longside+border &" "&shortside+border&" 0\n"&
         longside/2 &" "&shortside+fontSize*0.2&" 1\n"&
         "0 "&-fontSize&" 2\n"&
         longside&" "& -fontSize & " 3",    
         baseDir&"temp.txt");
    echo("# ID Label\n"&
         "1 "&quote(legendTitle)&"\n"&
         "2 "&quote("   "&round(minVal))&"\n"&
         "3 "&quote(round(maxVal)&"   "),
         baseDir&"temp.atr");
}
colouredit(colours,"file",baseDir&"temp.ctb");

# Open the vector file
annotation = open(baseDir&"temp.txt","points");
edit(annotation,"attributes",baseDir&"temp.atr");
edit(annotation,"attCol",2);

# Set the annotation drawing style.
vectorstyle("pointsize",0.1);
vectorstyle("showlabels","true");
vectorstyle("labelsize",fontSize);
vectorstyle("labelbackground","255 0");

# Draw the colour bar, title and key.
draw(baseDir&"legend.png",colours,"null",annotation);
legend.png (direction set to 'vertical'):
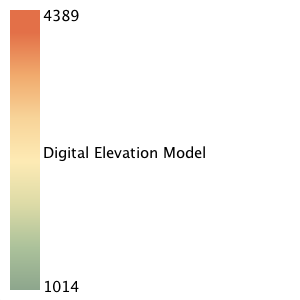
legend.png (vertical)


legend.png (direction set to 'horizontal'):

legend.png (horizontal)