
Automatic segmentation algorithm for the morphological analysis of microvessels in immunostained histological tumour sections
Despite the popularity of the staining for different proteins by
immunohistochemistry and the growth and power of computer and image
analysis algorithms, manual procedures are still common to assess the
presence, absence or intensity of staining by visual observation,
perform measurements, or count.
I have developed an image-processing algorithm for the segmentation and morphological analysis of microvessels from CD31 immunostained histological tumour sections. The algorithm exploited the distinctive hues of stained vascular endothelial cells, cell nuclei and background, which provided the seeds for a region-growing algorithm in the 3D Hue, Saturation, Value (HSV) colour model. The segmented objects were post-processed with three morphological tasks: joining separate objects that were likely to belong to a single vessel, closing objects that had a narrow gap around their periphery, and splitting objects with multiple lumina into individual vessels.
The following article describes the algorithm in detail: C.C. Reyes-Aldasoro, et. al., An automatic algorithm for the segmentation and morphological analysis of microvessels in immunostained histological tumour sections, Journal of Microscopy.
Together with other algorithms, CD31 stained images can be automatically processed through the CAncer IMage ANalysis website (CAIMAN) selecting "Segmentation of Endothelial Cells". The chromatic analysis of the images, which is part of the algorithm is also provided as a separate algorithm.
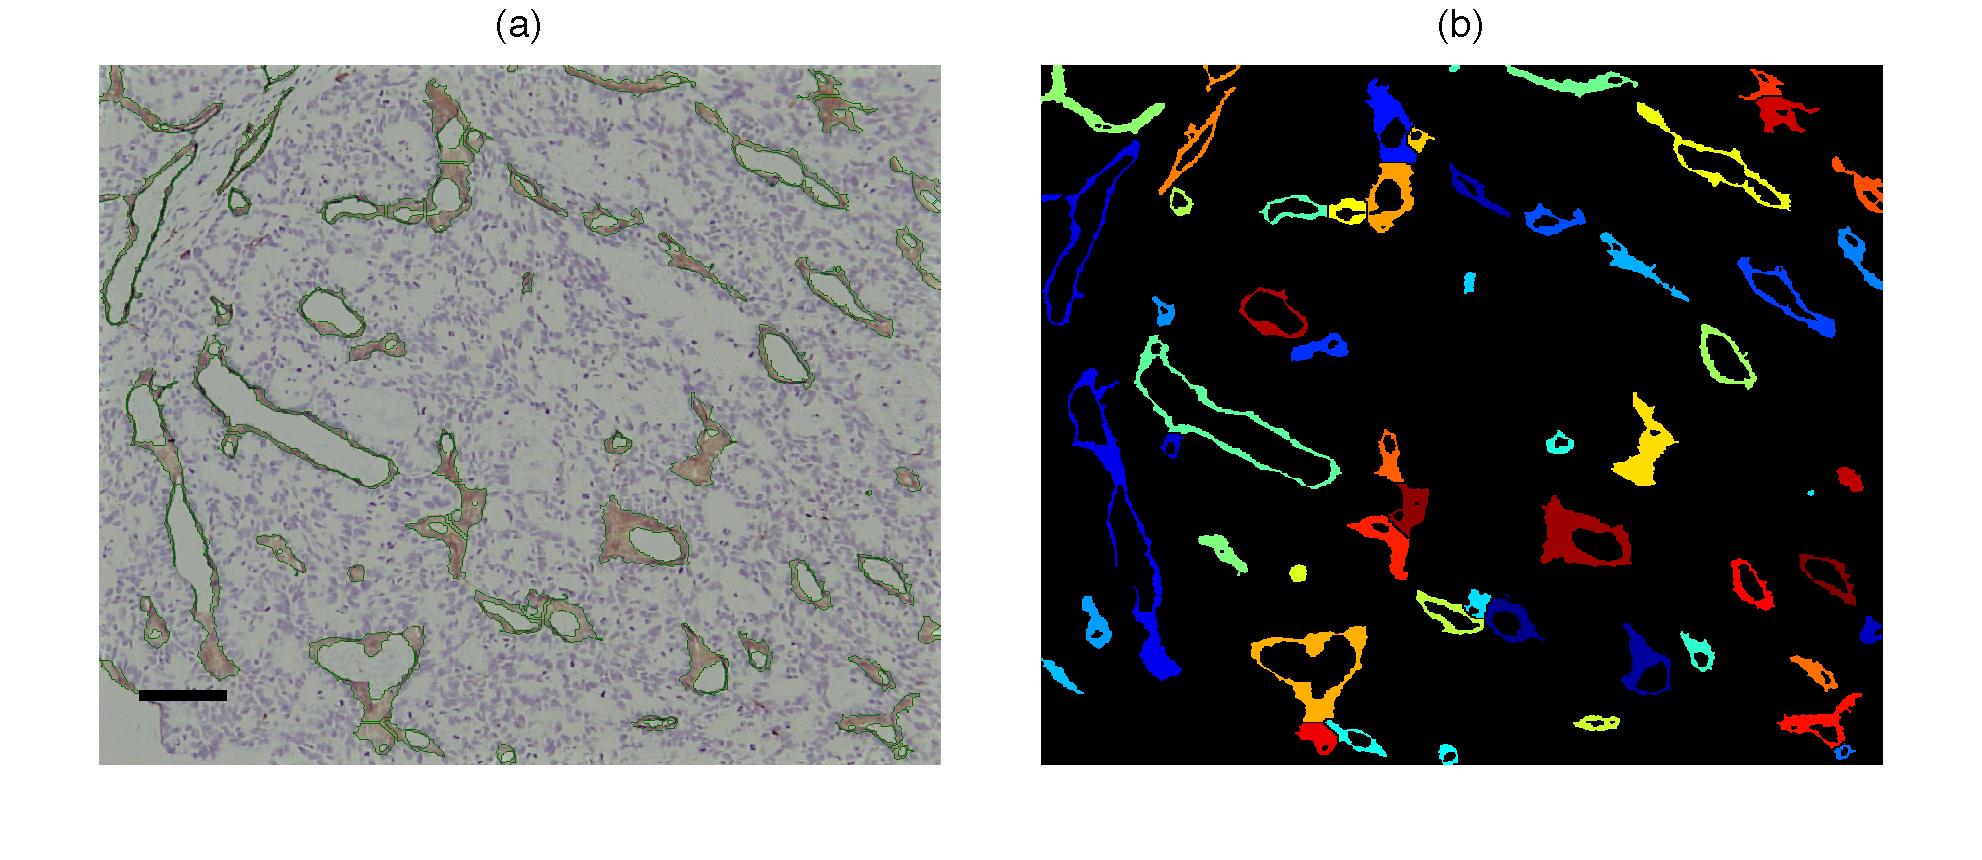
Vessel segmentation with the proposed algorithm. (a) Immunostained
images with object boundaries overlaid with green lines. Bar = 80 um.
(b) Segmented objects corresponding to the vessels on the left column,
each object was labelled with a different colour for visual
discrimination.
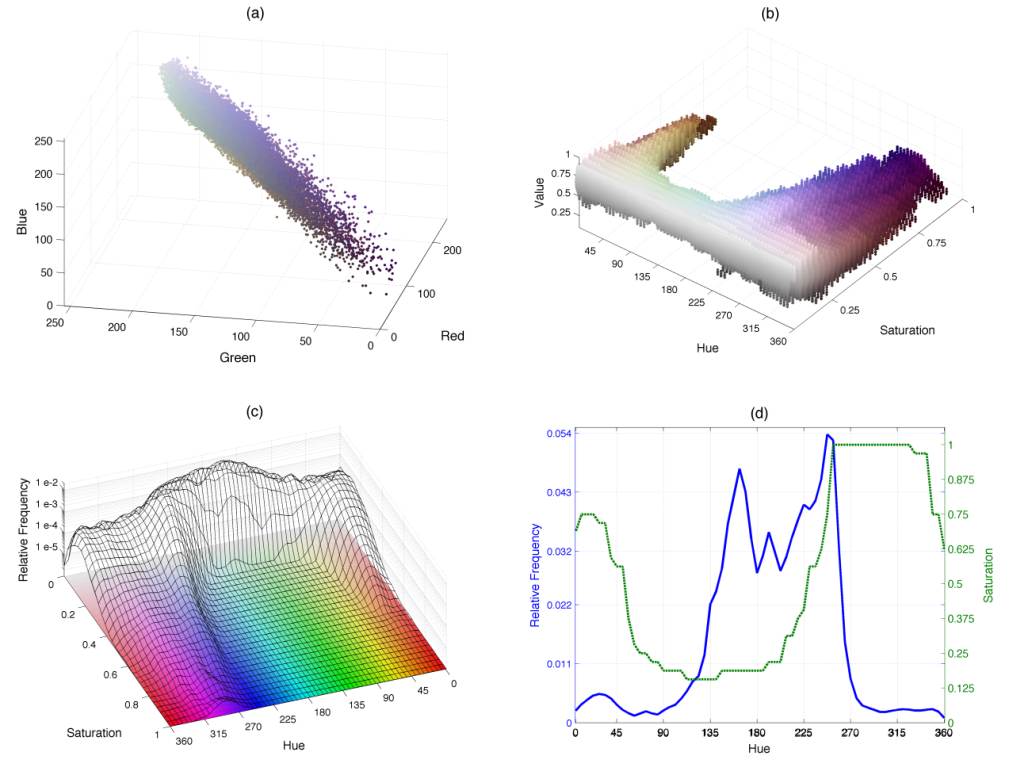
Graphical depictions of the coloured pixels from an immuno-stained section. (a) A cloud of coloured points describes the distribution of pixels within the RGB domain corresponding to Fig. 7a (centre). (b) Three-dimensional histogram mHSV(h,s,v) for the same image. A cloud of coloured points describes the distribution of pixels within the HSV domain. (c) Two-dimensional histogram mHS(h,s) overlaid on loci of constant value, notice the logarithmic z-axis. The higher peaks at the low saturation (s<0.2) correspond to the background pixels while the lower peaks in the foreground correspond to the pixels stained by immunohistochemistry. (d) One-dimensional hue histogram (solid blue line) and maximum saturation profile pmax S (green dotted line). While the histogram describes the relative frequency of the ranges of hue, pmax S indicates those hues that reach high saturations (intense colours, far from white or grey) within the images.
