
User Manual for removeLineArtifact
Contents
Introduction
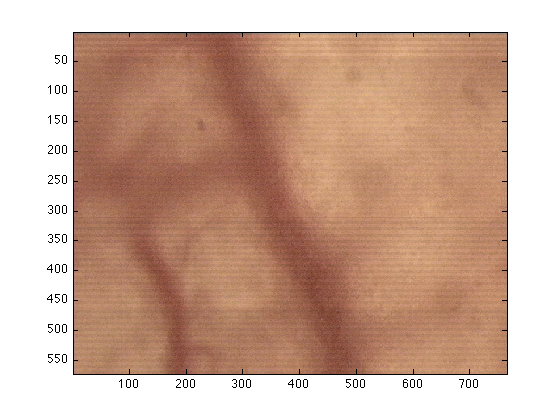
Images from the "new" microscope had, in some cases, some line artefacts, that is, they showed different intensities in some lines, not present in the original sample. This algorithm removes those lines.
Loading the data into Matlab
As always, you need to load the data into matlab, either by using imread or drag-and-drop. Refer to other manuals for more details. In this case, I will load them using imread:
dataIn=imread('ImageWithLineArtif.tiff');
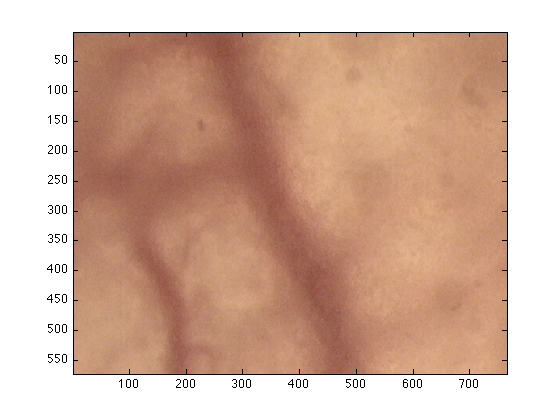
Once you have the image, simply run this command:
dataOut = removeLineArtifact(dataIn);
To compare the two images you can visualise them with:
figure(1)
imagesc(dataIn(:,:,1:3))

figure(2)
imagesc(dataOut)
To make the differences more evident you can plot the images together:
figure(3)
imagesc([dataIn(:,:,1:3) dataOut])
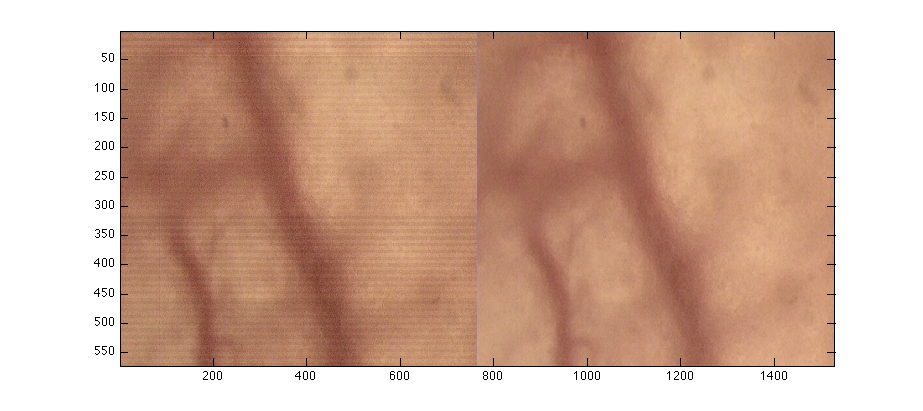
In the previous cases, dataIn has been restricted to 3 levels (:,:,1:3) as some tiff files use a fourth dimension.
Saving
To save your image, you can simply click on the "edit" menu from the figure, the go to "copy" and then you can "paste" it in word, powerpoint, ... You can also click on "File" then "Save" and select the name (e.g. "myFabulousImage.jpg") and the format (jpg,tif,bmp,...) you prefer.
%or save it as a matlab file in the following way:

save myFabuolusImage dataOut
This last file will save the data of "dataOut" inside the file myFabulousImage. You can save more things there, for instance
save myFabuolusImage dataOut dataIn
will save all the dataIn and dataOut.
