
User Manual for TriChromPercent
Contents
Introduction
TriChromPercent is a matlab programme that loads images that have been stained with three different fluorescent stains, allows the user to select a thresholding level and then segments the data by intensity thresholding, calculates the number of pixels above the given threshold and stores the results in a matrix file that can be easily copied into Excel for further analysis.
File Structure
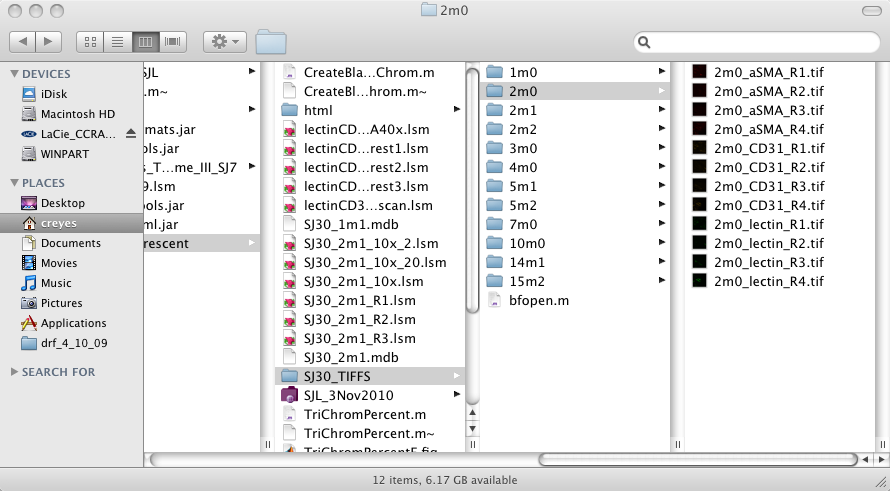
TriChromPercent follows a strict name structure which needs to be followed: All files will be stored in nested folders, that is, there will be a root folder (for instance SJ30_TIFFS ) inside which there will be many other folders. The second level of folders will have a name like 1m2, that is a number, then the letter 'm' then another number. These numbers will be used to identify files in the output results. Inside these folders there will be the images to be analysed. Again these have to follow a strict naming structure, for example 1m2_CD31_R1.tif.
The name of the folder is repeated (1m2) then between underscores
will be the stained used, these can be one of the following names CD31,
aSMA, lectin, No other names will be accepted and you
have to follow the same uppercase/lowercase combination. Finally, R1
corresponds to the region of interest, you can have as many regions as
desired. See the image below for an example.
Incomplete data
The software allows for the possibility of having one, two or three stains. That is, if you only stained for CD31 and aSMA, it is not necessary to have a lectin file. The programme will read the folders and will create black images where there is one (or two) stains missing.
Running the software
To run TriChromPercent you need to have Matlab open (refer to Matlab manuals) and type in the command line:
indexMatrix = TriChromPercent();
That will open a window through which you will select the root folder. Double-click on the name of the folder and two windows will open, the main TriChromPercent and a matrix. The processing will start with the thresholding levels of 127 for the three stains.
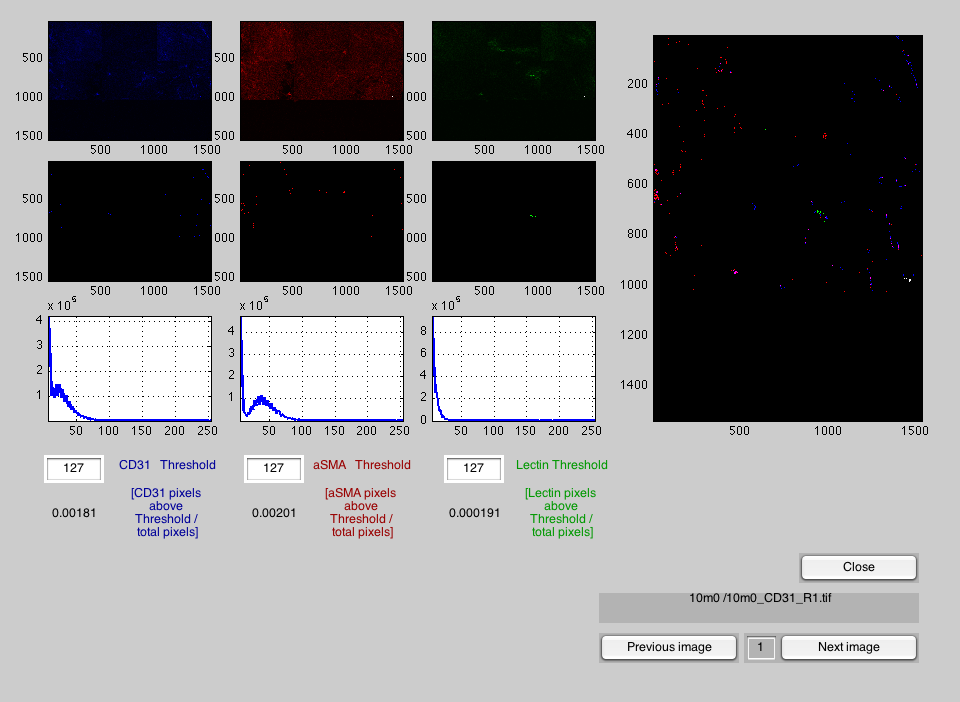
Main Window
The main window will present three images on the top left, one for each of the stained images, and immediately below, the thresholded pixels for each of them. As an aid to select the segmentation level, a histogram of each stain is presented below the images. To change the thresholds, simple go the the box of the threshold and type the new value. You can change these individually for each channel and the images will be automatically segmented and updated. On the right hand side, a combination of the three stains is presented.
Changing image
Once a suitable combination of thresholds has been achieved, you can change to the next image of the set by clicking the "Next image" button. The name will be displayed above the buttons. You can also return to previous images by clicking "Previous image" button and jump to any other image by changing the value of the box in between these buttons.
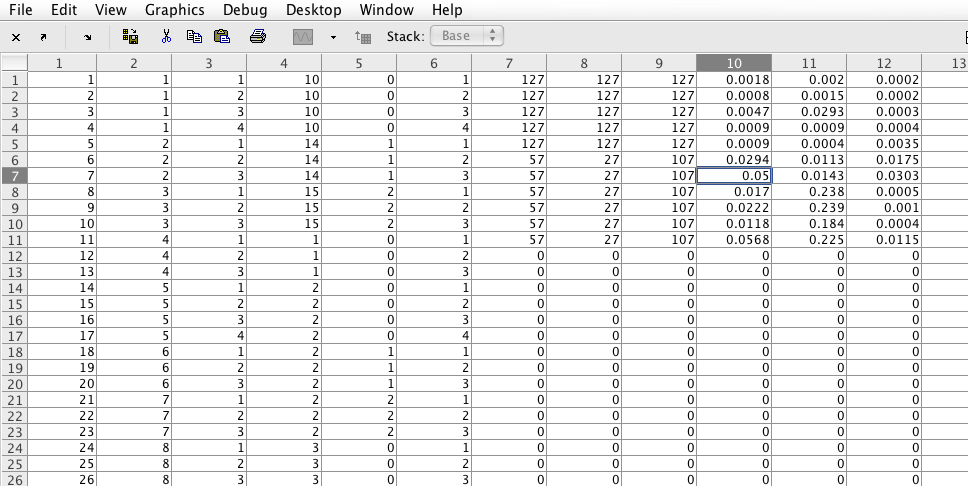
Results Matrix
The matrix with the results will have one line for each image analysed. The columns are coded in the following way:
Column 1 - Sequential number of the images
Column 2 - Number of the Folder
Column 3 - Number of the File inside the folder
Column 4 - First number (e.g. 1 for 1m2)
Column 5 - Second number (e.g. 2 for 1m2)
Column 6 - Region of the image
Column 7 - Threshold for CD31
Column 8 - Threshold for aSMA
Column 9 - Threshold for lectin
Column 10 - Percentage of pixes above threshold for CD31
Column 11 - Percentage of pixes above threshold for aSMA
Column 12 - Percentage of pixes above threshold for lectin
Results
When all images have been analysed, simply click "Close" and you can mark the cells in the matrix, and copy to Excel.
