
User Manual for regionGrowingCells
C.C. Reyes-Aldasoro, L Williams, S Akerman, C Kanthou and G. M. Tozer, "An automatic algorithm for the segmentation and morphological analysis of microvessels in immunostained histological tumour sections", Journal of Microscopy, Volume 242, Issue 3, pages 262–278, June 2011.
Contents
Introduction
regionGrowingCells is a matlab programme that loads images that have been stained for CD31 and applies an image-processing algorithm for the segmentation and morphological analysis algorithm for the analysis of microvessels from CD31 immunostained histological tumour sections. The algorithm exploited the distinctive hues of stained vascular endothelial cells, cell nuclei and background, which provided the seeds for a region-growing algorithm in the 3D Hue, Saturation, Value (HSV) colour model. The segmented objects were post-processed with three morphological tasks: joining separate objects that were likely to belong to a single vessel, closing objects that had a narrow gap around their periphery, and splitting objects with multiple lumens into individual vessels.
Loading the image
Once matlab has been started, the first step is to load the relevant image to be analysed, this can be done by dragging the image from the finder:
uiopen('/Users/creyes/Sites/testImages/endothelial/Endothelial1.png',1)
after which it is necessary to accept the import from the wizard, (just click FINISH), or loading it with imread:
Endothelial1 = imread('/Users/creyes/Sites/testImages/endothelial/Endothelial1.png');
Segmentation function
Any of these lines will leave the image as a matlab matrix in the workspace. Once the image is loaded, the first step to process is to run the function "regionGrowingCells".
[finalCells,statsObjects,finalCells_IHC] = regionGrowingCells(Endothelial1);
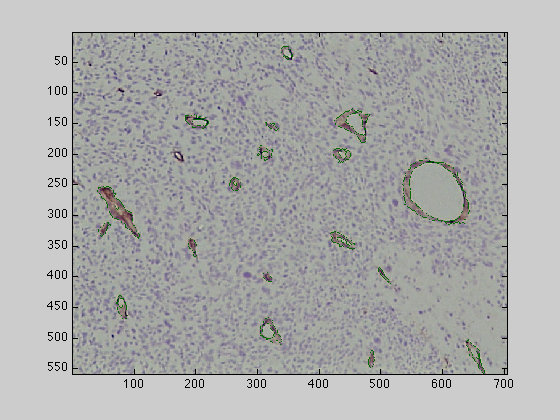
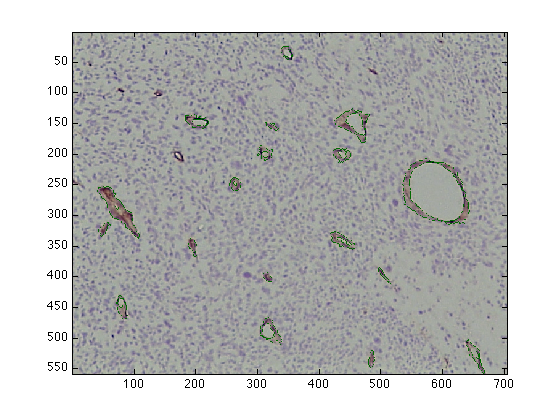
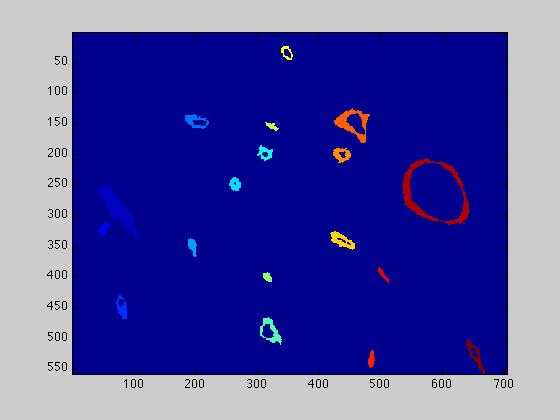
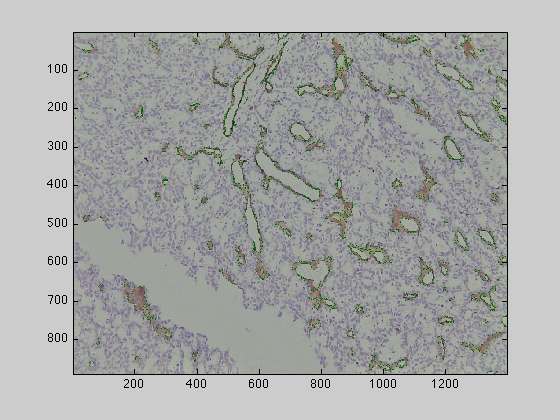
This function will process the image and will segment all the brown endothelial cells stressing the vessel like structures as detailed in the Journal of Microscopy paper. The function will display the resulting segmented cells directly, but you can plot it in a separate figure with the following commands:
figure(1)
imagesc(finalCells_IHC)

figure(3)
imagesc(finalCells)
Measurements from the vessels
From the segmented cells, it is possible to extract many measurements (also detailed in the paper). These are obtained with the following commands:
[ObjThickness,stdThickness,propLumen]    = findWallThickness(finalCells);
tempProps                               = regionprops(finalCells,'Perimeter','FilledArea','EquivDiameter');
For each object, perimeter, area, filled area, ... will have calculated and you may be interested in the average value for the whole image. To obtain the averages type:
avThickness                             = mean(ObjThickness);
avPerimeter                             = mean([tempProps.Perimeter]);
avArea                                  = mean([statsObjects.Area]);
avFilledArea                            = mean([tempProps.FilledArea]);
if avFilledArea>0
    lumenVesselArea                     = mean((([tempProps.FilledArea]-[statsObjects.Area])./[tempProps.FilledArea]));
    avRoundness                         = mean([tempProps.Perimeter]./(sqrt(4*pi*[tempProps.FilledArea])));
end
The last "if" is necessary as in some cases there may not be any objects and an error message would appear (do not worry too much about this, just copy-and-paste it).
Ratio of brown in the whole image
Finally, if you are interested just in the total amount of brown in the whole image, this can be calculated by adding all the pixels in brown and dividing by the size of the image:
ratioBrown = sum(finalCells(:)>0)/(numel((finalCells)));
Running the function over many images
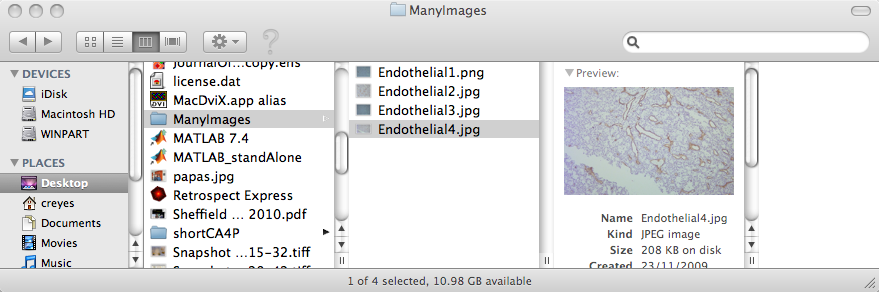
If you need to obtain any of the measurements for a large number of images, you do not need to load each of the images individually. You can put all your images inside a folder and then run them all in a single "for-loop". Create a folder on the Desktop (it can be anywhere but this is to simplify things for the example) named "ManyImages" (again, it can be any name, you would need to change it in the code below.
dirFiles = dir('~/Desktop/ManyImages/*.jpg');
the previous command will find all the jpg images inside the folder ManyImages. If your images are tif, or bmp, or another format, change the last three letters accordingly.
It may be the case that you have 2 formats, like png and jpg (but ideally all your images should be the same format) so the following line covers both png and jpg:
dirFiles = dir('~/Desktop/ManyImages/*.*g');
Next you need to find out how many files are inside the folder
numberFiles = size(dirFiles,1);
and then loop over each file in the folder:
ResultForMeasurement                                = [];

for counterFiles = 1: numberFiles
    % Load the current image
    currentImage = imread(strcat('~/Desktop/ManyImages/',dirFiles(counterFiles).name));

    %process it with the function
    [finalCells,statsObjects,finalCells_IHC]        = regionGrowingCells(currentImage);

    %calculate the measurement you want
    currentRatio                                    = sum(finalCells(:)>0)/(numel((finalCells)));

    %and store it in a matrix that can later be copied to excel:
    ResultForMeasurement(counterFiles,1)           = currentRatio;

end

disp (ResultForMeasurement)
Final warning
One V*E*R*Y important thing to notice is that Matlab will not read the files in the same order as the finder of the Macs, therefore the order of the files stored will not be exactly the same as the one you will see with the finder. Matlab will read the file names sequentially, so File2 will come after File1, File11, File12, ...
