Manual to use the quantification of expressions and nuclei
To use the matlab functions, the first requirement is that the ALL the images are saved in one folder (say images) and then a subfolder for each channel of the data with the following order:
   channel0 - YELLOW = Phalloidin staining of ACTIN fibers')
   channel1 - RED    = Alexa staining of ELASTIN')
   channel2 - BLUE   = DAPI nuclei')
   channel3 - GREEN  = Second harmonic imaging of COLLAGEN')
Contents
When you have several experiments, you can save each experiment in a folder, that is all the folders of the channels per separate folders, e.g. images/channel0, images/channel1, images/channel2, ... images2/channel0, images2/channel1, etc.
Then, you need to save the matlab functions in any working folder, for instance, the same folder where you will have the folders for the data.
Quantification of the expression
To quantify the expression of all channels, the nuclei, etc., you will use the function "QuantifyRelativeExpression", to do this, open matlab, change to the working folder and then call the function in the following way:
[totExpression,locExpression,numFinalNuclei,finalData,ElastinVsCollagen,NucleiVsElastinBoundary] = QuantifyRelativeExpression('images');
190 images in folder, with dimensions:1024 x1024 x1This function, opens all the images in the folders and through several steps will detect the boundaries of the Elastin, the expression of each channel by detecting the pixels (voxels actually since the data is 3D) above thresholds, and quantify the number of elements in each of the channels. These results will be stored in the variable "totExpression". Then, the boundaries of the elastin will be used to distinguish the expression inside them and the results will be stored inside the variable "locExpression". The nuclei will also be counted and the number will be split into those nuclei that are (a) inside the elastin boundaries, (b) outside the boundaries and (c) those that are touching the boundaries.
You can always call the function without parameters like this
[totExpression,locExpression,numFinalNuclei,finalData,ElastinVsCollagen,NucleiVsElastinBoundary] = QuantifyRelativeExpression();
and then a window will open and you can select the folder with the data manually. To visualise the results you can just type on the command prompt the name of the variable:
totExpression
totExpression =

    20680441    18914975     1363137     4932066
Displaying the data
To display the data you have processed, you can use the function surfdat in the following way:
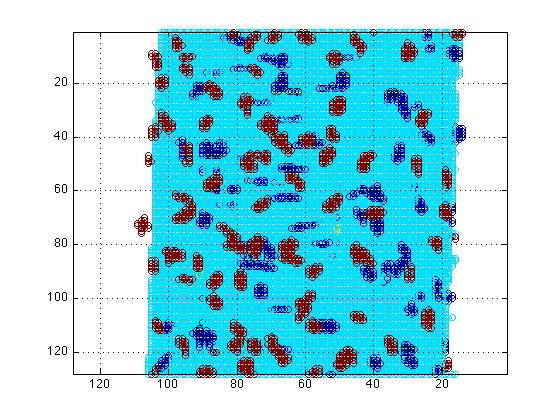
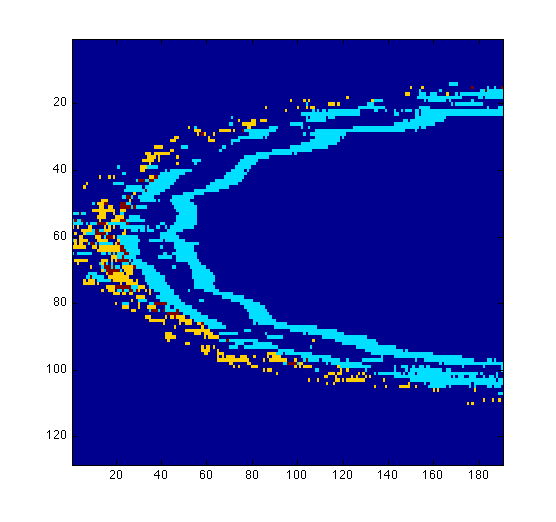
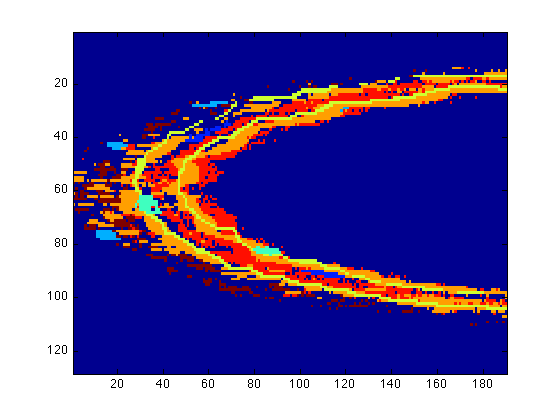
figure(1)
surfdat(NucleiVsElastinBoundary(51,:,:))

figure(2)
surfdat(ElastinVsCollagen(51,:,:))

figure(3)
surfdat(finalData(51,:,:))

Or try the three-dimensional view:
surfdat(NucleiVsElastinBoundary,'all')
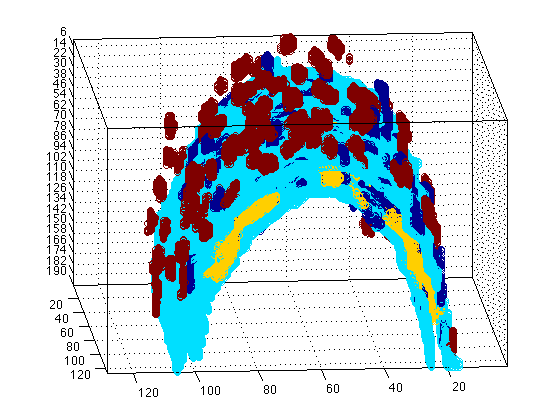
The previous plot is Three-dimensional, so you can rotate it to have a better view, or you can type to change the view:
view(90,90)